The AWE Instruments Secure Cloud can support multiple Online Data Loggers.
This allows you to connect up to 12 inputs to a single Online Data Logger.
Then 10 further Online Data Loggers can be connected to your account on the AWE Secure Cloud. Enabling up to 120 connected instruments located almost anywhere in the world to be monitored from your account.
Multiple processes and sensor measurements types are supported, and with our Open Data format you can tabulate them using your own spreadsheet software, or you can generate graphs directly from the AWE Secure Cloud from within the online portal.

Each Online Data Logger will let you connect up to 12 different instruments directly to the device.
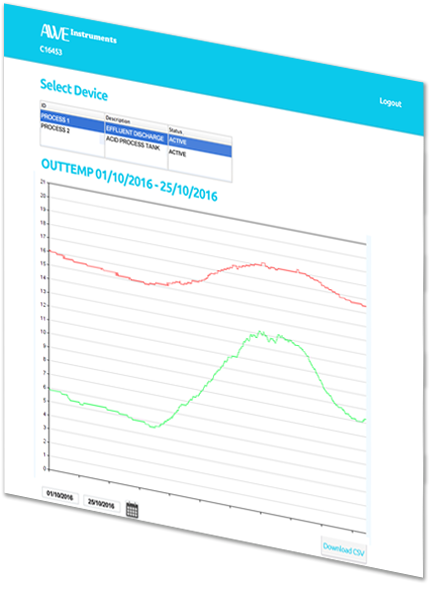
The data from each of the inputs is viewable on a single chart allowing you to cross correlate process data together - whether its flow, pH and temperature, or whether you're comparing the pH at the beginning of a process and at the end of the process - all the constituent parts of your process can be tied together to give you a complete view of your process.
You can select to view a single input in isolation to understand how it's reacting to changing conditions, for both process monitoring or for fault finding, or view the data as a collective whole.
Using our Open Data technology, inputs can be isolated and the data can be viewed only including the data that you wish to view.
Each Online Data Logger is setup to monitor your parameters of choice - whether it's PPM, pH, mV Redox potential, NTU's or Temperature - ensuring that the device is supplied pre-configured and ready to operate with your sensor of choice.
Our Online Graph technology self scales the chart so that they can be easily taken from AWE Secure Cloud and dropped directly into emails, presentations or for publishing online.
We let you choose the granularity of your data.
The data from each sensor is monitored from moment the instrument is connected, right through until the last 30 seconds.
This means that if you want to plot a graph of your data from when the device was first connected until just seconds ago - you can. There is no limit to the storage of your data either - meaning that your data is both secure, and always available - even if it was connected months or even years ago.
We take a data centric position with our Online Data Logger - so you can choose to drill down over a period specified by you, whether it's annually, quarterly, monthly, the last 21 days, or even the last 10 minutes - your data is always available and can be viewed in as much or as little detail as you want.
Our graph technology is platform neutral - allowing you to view the data on your smart phone, tablet device, or a computer, ensuring your data is available when you are.
Understanding the way in which processes work and when multiple parameters is critical to many of our customers - so we ensure that you can download your data, into an Open Data format - so you can manipulate it in your spreadsheet software, any way you want.
Don't worry if you lose your copy of the data - all your data is always available online in the AWE Secure Cloud.

The AWE Secure cloud is our secure data centre where your process data is stored.
Log into it using your smart phone, tablet, or computer and you can view your data in chart or raw format direct from your device.
You can also download your data to your device for use in your speadsheet software.
The data is always available - right from when the instrument was first connected right through to just moments ago.
The AWE Secure cloud and the Online Data Logger work together to ensure you can see your data, when you want it.


